
Newsletter 8: Navigating the Nuances: A Compass for Tech Investment Metrics

Did you know? Peter Drucker never actually said, 'What gets measured gets managed.' I have bit my tongue innumerable times when executives have shared this misquote in support of their quixotic pursuits. Invariably it ends poorly, but we of the management have another unfortunate credo “never give up”.
While I’ve learned to refrain from correcting every misattributed quote in boardrooms, in this space—with peers who value precision—I'll take the liberty to set the record straight. This brings us to Goodhart's law, a principle that echoes the sentiment often miscredited to Drucker but delves much deeper into the consequences of measurement.
Goodhart's law is an adage often stated as, "When a measure becomes a target, it ceases to be a good measure.” It is named after British economist Charles Goodhart, who is credited with expressing the core idea of the adage in a 1975 article on monetary policy in the United Kingdom: “Any observed statistical regularity will tend to collapse once pressure is placed upon it for control purposes.”
So should we NOT measure our technology investments?
The Point: Through the Telemetry Lens; Observing Tech Investments
I like to often think about the measurements in technology investment using two allegories.
The first allegory draws from the concept of 'Rational Expectations.' When people are incentivized to sell more cars, they will push hard to increase sales, even if it results in a loss. This single-minded pursuit can overshadow the broader objective of profitable growth. It’s a similar case with technology costs. If the incentive focuses purely on cost management, other crucial aspects such as the return on investment or customer satisfaction may fall by the wayside. This narrow approach can often backfire—this much I've seen firsthand.
Let's pause here to let that sink in before we explore another metaphor.
Moving to the second allegory, let's talk about telemetry. For those who may not be familiar, telemetry is the automatic measurement and wireless transmission of data from remote sources. In the engineering world, it's a vital tool that allows us to monitor and manage complex systems from afar. This concept has captivated me since the early days of my engineering career. In cars, aircraft, oil rigs; engineers operate the world based on telemetry data. They use it as a decision making mechanism, not an objective function. I was fascinated by the success of SpaceX through their radical transparency with all of their launches including all the failures and their use of telemetry data to manage their craft and the launches. In fact amateur radio operators were able to lock into 2232.5 MHz telemetry downlink from a Falcon 9 upper stage. In addition to interesting plaintext snippets from the unencrypted feed they were able to capture some amazing images from the spacecraft's cameras. After that discovery was public, SpaceX chose to encrypt that data. Here is the GitHub link with some of the data captured if you're interested: https://github.com/shahar603/Telemetry-Data
You might be wondering, with a touch of skepticism perhaps, 'How do we then observe our technology investment without falling into the trap of misused metrics?' It's a valid concern. We certainly can't operate on gut feeling alone, can we? Here's what I think:
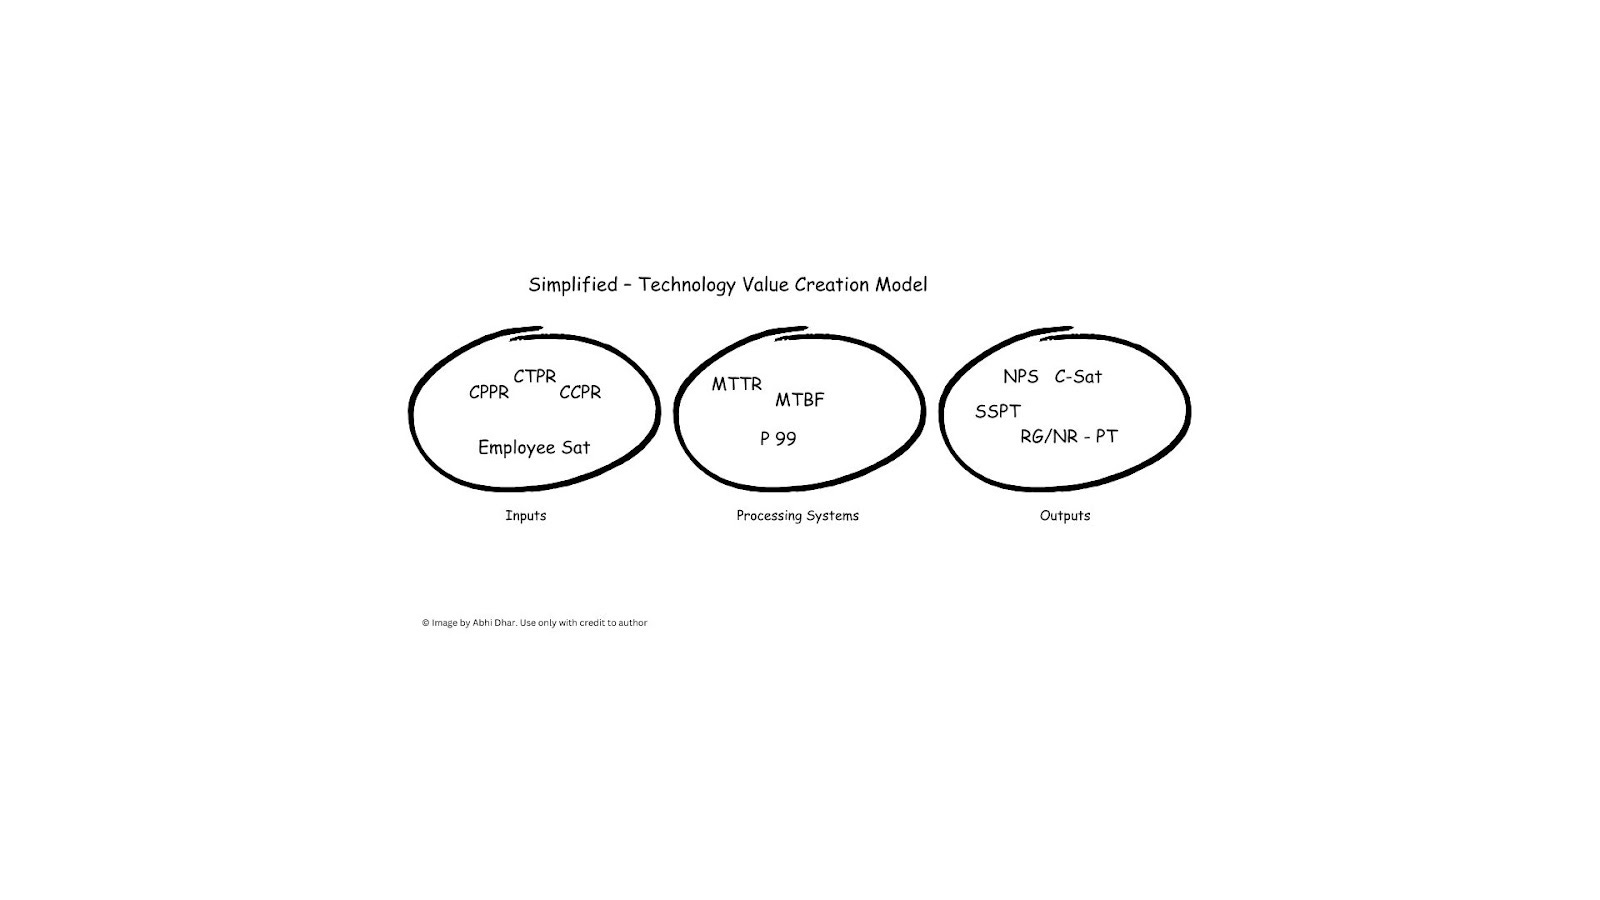
I look at it as a simple mechanism: on one side we have Inputs (cost side) which are applied to the Methods and Processes (Processing Systems - improving or deteriorating) leading to Outputs (value side) that can be evaluated versus expectations.
You can look at this continuum in any order. There are merits to working “outcome back”, optimizing the processes to adjust input for better outcomes or working the inputs to determine which are most causal. It depends on the business and the situation.
For our purposes today, I will just go left to right. Fair warning, all these notions, terms and acronyms are mine. Feel free to use, just make sure you give credit back every time you use them.
Cost is an important consideration. True cost is a crucial input because it affects margin. Investment, because it allows us to pursue revenue and growth. Upon closer inspection,it turns out that the objective function is not cost, it is margin and revenue growth.
I use four metrics on a trend to ensure we are heading in the right commercial direction with an even keel and steady pace. These are all notionally anchored off of revenue but can be anchored on the right top line metric; if not revenue, net sales can be used, even gross margin depending upon the nature of your business.
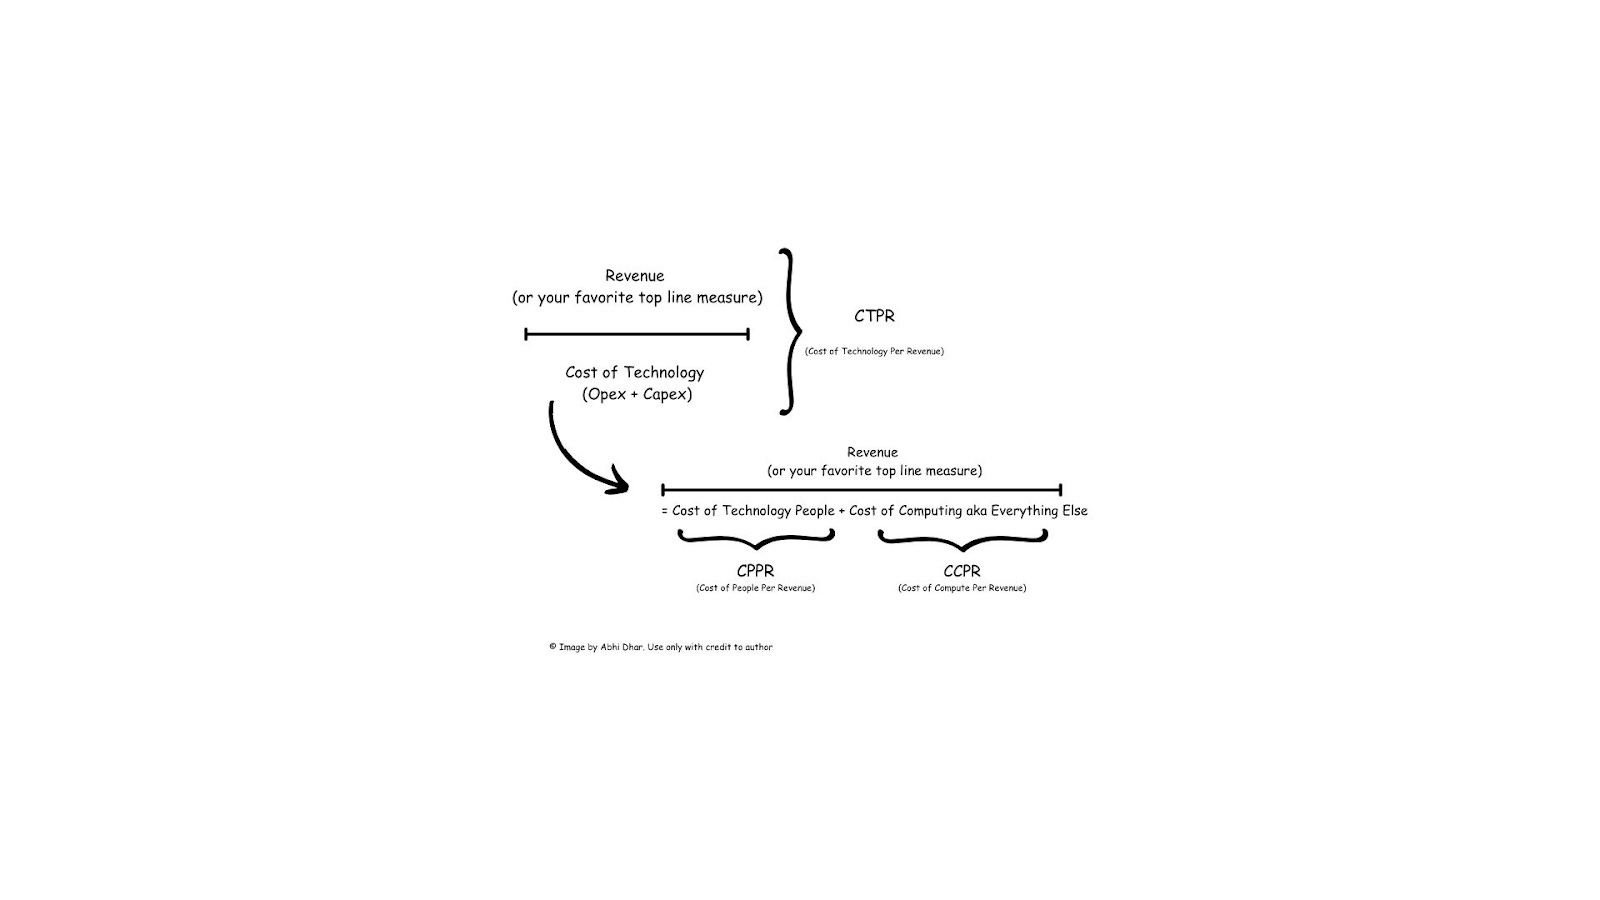
So, let's observe the trend of our technology spend as a proportion of revenue. Its a great index but if it starts acting wonky what should we do? That's where the highest level cost components come in. To make sure we have the right mutually exclusive and comprehensively exhaustive (MECE) levers to respond with, let us also track Cost of Computing per Unit of Revenue (CCPR), this is spend on tech that is not people related. Separately, let's measure the Cost of Technology People Per Unit of Revenue (CPPR). Now we can see labor cost increases that are outpacing the trend or negatively impacting margins and make decisions. We can also see if our licenses, hardware or SAAS or Cloud usage is accelerating rapidly versus historical or in relation to top line and form strategies that address. Its about trends, like a sailboat that we can navigate if we have an understanding of the conditions over time.
Alternatively, a short-sighted approach would be to simply reduce costs indiscriminately.
Understanding the resilience of our technology systems is critical to maintaining smooth business operations. That's where the Mean Time Between Failures (MTBF) metric becomes essential—it measures the reliability and stability of our systems by tracking the average time between outages. A higher MTBF indicates a more reliable system, which means fewer disruptions for customers and staff. Similarly, Mean Time to Repair (MTTR) measures our agility in responding to issues. A shorter MTTR reflects a robust incident response capability, ensuring that when problems arise, they're resolved swiftly, minimizing the impact on our operations and maintaining the trust of our users. The first tells us how many gremlins lurk in our systems that cause failure. The longer the duration between failures the less stress for all involved. This normally turns into a hunt for gremlins with team members finding all sorts of things that cause failure and removing them improving MTBF and the quality of life for the team. MTTR is just how effective we are when bad things happen. It's a testament to the responsiveness of the team, bad things happen to all teams. Good teams fight back! MTTR is how they keep score. It's like the movie Predator, in systems we always have “something out there, and it is hunting us!”
Yet, mere availability doesn't equate to excellence. The finesse with which our technology operates is often measured by its latency—the speed at which it responds to our users' requests. Latency isn't just about keeping pace; it's a direct reflection of the user experience. In today's fast-paced digital world, where customer satisfaction is paramount, a lagging system can be a major deterrent. That's why we look at latency at the 99th percentile (P99), assessing the slowest responses our users experience. It’s not just a number; it’s a benchmark for ensuring that even at its worst, our technology remains a reliable and efficient servant to our customers, thereby upholding our commitment to quality and performance.
How about the technology that we place in front of our associates and not customers? A good goal is to make sure it is not a detractor from their work. To make it meaningful it always makes sense to measure satisfaction. A lot of employee engagement methodologies have a question like “Do I have the tools to do my job?” It's good and apparently correlated to employee satisfaction but not useful to respond tactically. This is why it is crucial to collect in-interaction feedback and end-of-interaction feedback, both qualitative and quantitative. This is best collected using statistical sampling techniques to form a comprehensive understanding. Coupled with periodic surveys we can form a reasonable expectation of Employee Technology Satisfaction.
Extending that notion to the outcomes side, for customer facing technology well established measures like Net Promoter Score (NPS) or Customer Satisfaction (C-Sat) describe to us how we are showing up in front of our customers. The benefit of these metrics is that we can also find out how we are doing relative to market, industry and sector. Good telemetry to have, kind of like the Formula 1 screens I see on TV during race day.
For product development the key effectiveness metric is incremental revenue. Are people paying us for the stuff we are building?It gets complex quickly with marketplace dynamics, specifics of the business and various inputs depending upon the product. However, one thing is for certain, this can only improve if we can ship more things faster! It increases the “at bats” that we get to find the great performers.When we talk about "at bats" in a business context, we're borrowing a term from baseball, where it means the number of opportunities a player has to hit the ball. Similarly, in product development, it refers to the number of times we can present new features or products to the market. The more frequent our "at bats," the higher our chances of delivering value that resonates with our customers and drives revenue. It then follows that the thing to actually watch is Shipping Rate. How fast can we ship without collateral damage (Successful Ships Per Unit of Time - SSPT). This takes work in engineering, product, user experience, consumer experience, marketing; everybody has to be on this drill. Then we can watch revenue associated with each release and growth over a number of releases (Revenue Growth/Number of Releases per unit of Time RG/NR - PT). It's cool to watch more releases creating more value or jumping in and turning the steering wheel when they are eroding value.
So to summarize these metrics in our simplified value creation model, here is a simple pictorial.
I will end with the acknowledgement that there is peer reviewed research that will provide for hundreds of measures. This essay is not about that.
The Counterpoint
The conversation around measuring developer productivity isn't new, yet it continues to be a contentious topic. In presenting a Counterpoint, let's explore an alternative perspective put forward by industry experts, which challenges our approach to evaluating productivity in the software development realm.
“Yes, You Can Measure Software Developer Productivity" by McKinsey & Company in June 2023. Recently the venerated management consulting firm ignited a firestorm by asserting that not only can developer productivity be measured, that it should absolutely be done. The article argues that software developer productivity can and should be measured, despite common skepticism. It proposes three primary metrics:
Output - Features, stories, points completed per developer
Lead Time - Time from starting work to deploying code
Utilization - % of capacity spent on new features vs maintenance
These metrics should be adjusted for complexity and quality using surveys. Data should be transparent to developers and contextualized over time.
Used properly, productivity metrics identify high performers, showcase ineffective workflows, and enable data-driven improvements through benchmarking. But measurements must be implemented carefully to avoid perverse incentives.
Overall, the article makes a case for quantified productivity metrics while providing guidance on pitfalls to avoid. It aims to shift developer productivity from an intangible to a measurable management priority.
In response let me check the day, month and year to make sure I haven't gone back in time. Then let me refer you to the start of my essay and Goodhart. Finally, I direct you to this piece of satire. McKinsey: Last Week Tonight with John Oliver (HBO)
The Aside: Lessons from Cobras and Poppies
In the annals of misguided incentives, the “Cobra Effect” stands out as a cautionary tale against the unforeseen repercussions of our actions. This quirky historical footnote dates back to colonial India, where British officials, eager to reduce the cobra population, offered a bounty for every dead snake. Enterprising locals, spotting an opportunity, began breeding cobras to claim the reward, ultimately increasing the snake population when the scheme was abandoned and the worthless cobras were released. It’s a tale as ironic as it is instructive.
Fast forward to more recent times, and we find the U.S. Army grappling with a feral pig problem at Fort Benning. The solution? A bounty for pig tails. Yet, the pig population soared, not due to fraudulent claims as one might expect, but rather because the hunting program inadvertently improved the pigs' living conditions, leading to a population boom.
And then there’s the saga of Afghan poppy farmers who, when offered cash to destroy their crops, doubled down and expanded their cultivation to maximize the returns from the government’s well-intentioned cash-for-poppies program.
These stories, though removed from our digital world, resonate with familiar echoes. They remind us of the delicate balance between intention and outcome, a balance we continually strive for in measuring and managing technology investments. The Cobra Effect isn’t just about snakes or pigs or poppies; it’s about the unpredictable nature of complex systems, whether ecological or technological.
As we close this discussion, let’s carry with us not just the caution but also the curiosity and adaptability that these stories inspire. They encourage us to look beyond the numbers, to stay agile, and to remember that the world often answers our plans with its own unexpected twist.
Take care of yourself.
-abhi